CommandiX Open demo

Revenue execution

Sales Team Performance Dashboard: Examples, KPIs, and the Two-Click Executive Drill-Down

See what a sales team performance dashboard should show, which KPIs matter, and how executives can drill from revenue signal to sales tasks and owners.

Dashboard sales signal
Dashboard sales signalExecutives see pipeline, weighted value, active deals, and revenue trend in the command center.

Key takeaways

  • A sales team performance dashboard should connect pipeline metrics to execution work.
  • Rep comparison is only useful when it includes deal stage, task follow-through, workload, and blockers.
  • Commandix lets executives drill from company dashboard to sales unit, people, deals, and tasks in a few clicks.

A sales team performance dashboard should do more than show pipeline charts. Executives do not only need to know whether pipeline exists. They need to know whether sellers are doing the work that converts pipeline into revenue, which deals are stuck, which reps are overloaded, and which internal handoffs are slowing the team down.

Most sales dashboards stop inside the CRM. They show stages, values, probabilities, and activities. That is useful, but it is not the whole revenue system. Enterprise sales depends on proposals, security answers, product demos, implementation confidence, legal review, executive sponsorship, and follow-up discipline. If those tasks live outside the dashboard, revenue risk arrives late.

The KPIs that actually help executives

Sales leaders need a small number of signals that explain movement. Open pipeline tells you potential. Weighted value tells you risk-adjusted potential. Active deals tell you workload. Won revenue tells you output. Overdue sales tasks tell you where execution is slipping. Rep-level performance tells you where coaching or capacity changes may be needed.

KPIWhat it answersLeadership risk if missing
Open pipelineHow much opportunity exists?Forecast debate without a common base.
Weighted valueHow much revenue is probability-adjusted?Pipeline optimism masquerades as forecast.
Active dealsHow many opportunities need attention?Seller workload becomes invisible.
Sales tasksWhat work must happen next?Deals stall after good conversations.
Rep comparisonWho is moving revenue and who needs help?Coaching becomes political or anecdotal.

The two-click executive drill-down

The valuable move in Commandix is the drill-down. From the executive dashboard, leaders can open the sales unit and move into the people, deals, and tasks behind the revenue signal. That is the difference between reporting and operating. A dashboard says Sales is behind. A command center shows who owns the deals, which tasks are overdue, where the handoff is stuck, and what action should happen next.

Revenue operator rule

If a sales dashboard cannot show the work behind the number, it is a scoreboard. Scoreboards do not close deals. Operating systems do.

Sales unit overview
Sales unit overviewOpen the sales team from the dashboard and inspect performance without waiting for a CRM export.

Sales rep performance without lazy stack ranking

Comparing sellers can be useful, but only when the comparison is fair. A rep with lower closed revenue may be carrying harder deals. A rep with many overdue tasks may be overloaded by internal requests. A rep with fewer activities may be working fewer but larger opportunities. Performance dashboards should reveal context, not flatten people into vanity rankings.

Commandix is especially useful because sales performance sits next to execution work. Leaders can compare seller output, then inspect the task queue and pipeline context. If one rep is weak on follow-up, that becomes coaching. If every seller is waiting on implementation answers, the bottleneck is not sales discipline. It is the system around sales.

Examples of dashboard views

Executive view

Open pipeline, weighted value, active deals, and won trend.

Team view

Sales unit performance, people, tasks, and history.

Deal view

Stage, value, owner, probability, next work, and risk.

The executive view is for deciding where to look. The team view is for deciding who needs help. The deal view is for deciding what action moves revenue. Good dashboards make those transitions feel natural because revenue work is not linear. A stalled deal may require a seller, product lead, legal reviewer, executive sponsor, or customer-success owner.

Sales people performance
Sales people performanceCompare sellers by revenue movement, task follow-through, and operating context.

CRM dashboard vs Commandix

QuestionCRM dashboardCommandix
What is in pipeline?Strong.Strong, with operating context.
Who owns the deal?Strong.Strong, plus task and team context.
Why is the deal waiting?Often hidden in notes.Visible through tasks, blockers, and constraints.
Which internal team is slowing revenue?Usually outside CRM.Visible through departments, workload, and actions.
What should leadership do?Interpret manually.Drill into owners, work, and constraint actions.
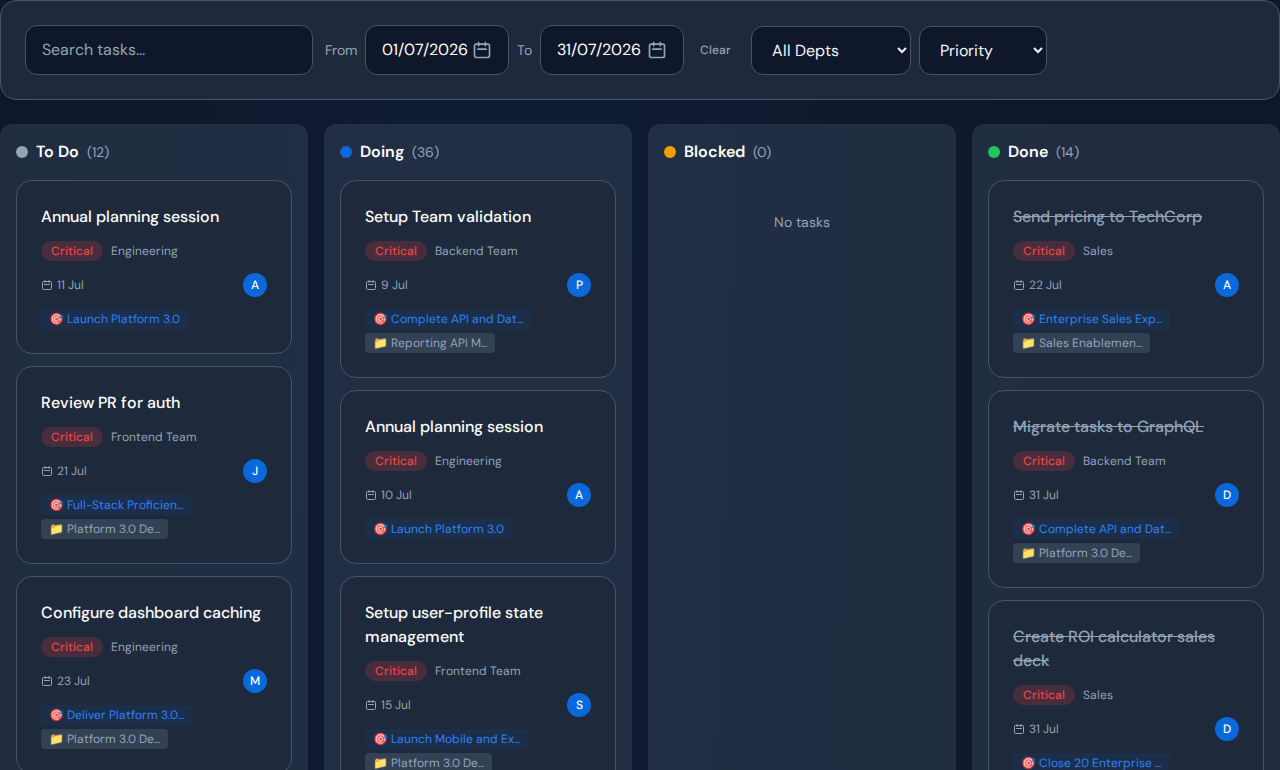
Sales tasks
Sales tasksSales performance becomes actionable when deal work and follow-up tasks are visible.

How to use the dashboard in a weekly revenue review

Revenue review checklist

  • Start with weighted pipeline and active deals.
  • Open the sales unit and compare seller performance with context.
  • Review overdue sales tasks and proposal follow-up work.
  • Identify deals waiting on non-sales teams.
  • Assign one action that moves the highest-value blocked revenue.

The best sales dashboard creates urgency without panic. It helps the CRO and CEO see the same revenue reality. It stops the meeting from becoming a tour of anecdotes. It shows where revenue is moving, where it is waiting, and what operational action can increase the odds of closing.

Fast win

Pick the five highest-value open deals. For each, ask: what is the next task, who owns it, and what internal constraint could delay it?

What weak sales dashboards get wrong

The weakest dashboards make activity look like progress. Calls made, emails sent, meetings booked, and notes logged can all be useful, but they do not prove that revenue is moving. A rep can be highly active and still fail to advance the right deals. Another rep can log fewer activities because they are working a smaller set of complex enterprise opportunities that require deeper internal coordination.

Weak dashboards also hide internal friction. In enterprise sales, the constraint is often not the seller. It may be implementation confidence, legal review, security questionnaires, product fit questions, executive alignment, or proposal quality. If the dashboard only shows CRM stages, the revenue team may blame sellers for a system problem. That creates pressure without progress.

Commandix helps because it treats sales as part of execution. A stuck deal can be inspected through tasks, owners, departments, and constraints. The sales leader can ask better questions: is this rep failing to follow up, or are they waiting on another team? Is the deal weak, or is the company slow to produce the proof the buyer needs? Is the pipeline low quality, or is execution after demo the real bottleneck?

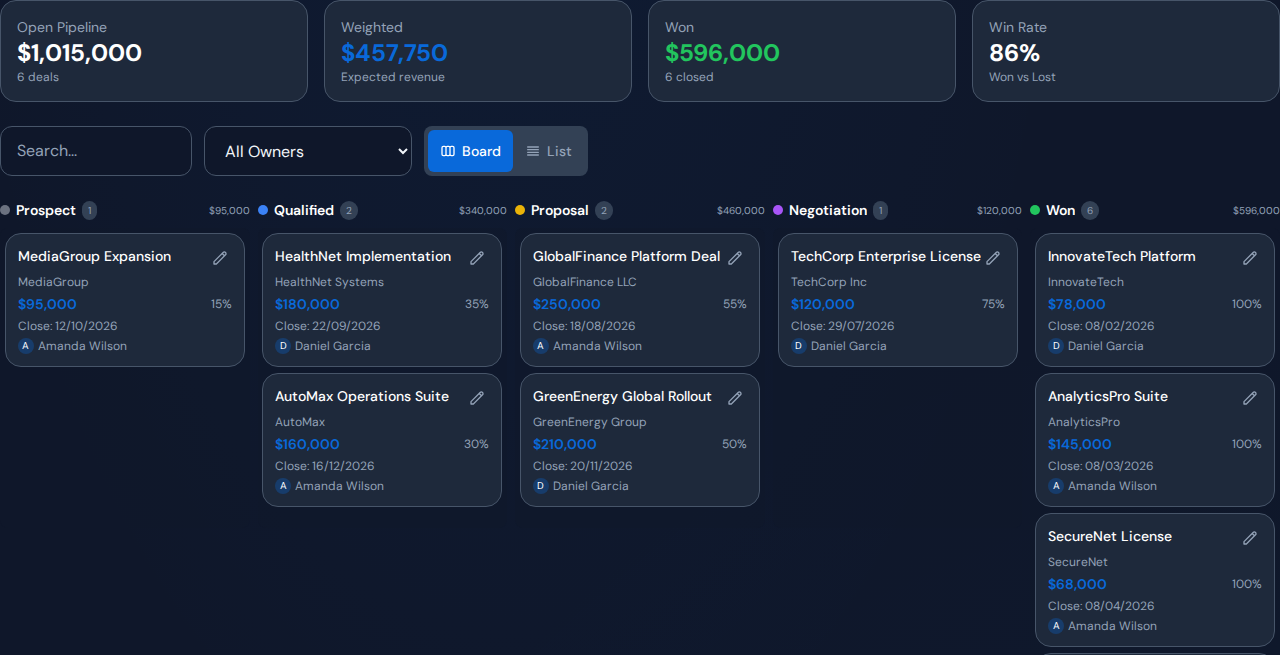
Sales pipeline deals
Sales pipeline dealsPipeline views show deal value, stage, owner, probability, and execution risk.

Dashboard layout that converts into action

A high-performing sales dashboard should move from summary to drill-down. Put pipeline and weighted value at the top because executives need orientation. Put rep and deal views next because managers need coaching context. Put tasks and overdue work close to the deal view because action lives there. Then connect the whole view to constraints so leadership can see whether sales is blocked by its own follow-up or by the surrounding organization.

This structure matters for adoption. Sales leaders do not need another report they admire and ignore. They need a workflow they can use in a Monday revenue meeting. The dashboard should help them leave with three decisions: which deal needs help, which rep needs coaching or protection, and which internal constraint must be cleared before it costs revenue.

Example: when the best seller is not the cleanest seller

Imagine one seller has the most overdue tasks, but also owns the largest enterprise opportunities and the highest weighted value. Another seller has a clean task list but mostly handles smaller deals. A shallow dashboard may celebrate the clean task list and punish the overloaded seller. A serious dashboard asks a better question: is the overloaded seller failing, or is the company over-routing high-value work through one person?

That question changes the management response. The right move may be coaching, but it may also be deal support, proposal help, calendar protection, or reassignment of low-value tasks. Commandix makes this visible because sales work is not isolated from tasks and team load. The dashboard can show when a seller needs accountability and when they need the system to stop wasting their selling capacity.

Sales flow analytics
Sales flow analyticsFlow and workload signals explain whether sales execution is blocked by the broader system.

What to publish for SEO inside this topic

The highest-value search variants are "sales team performance dashboard," "sales rep dashboard examples," "sales KPI dashboard," and "sales performance dashboard template." A strong page should answer all of them without becoming generic. It should include KPI definitions, dashboard examples, a comparison table, and a product walkthrough. That mix satisfies search intent while moving the reader toward a demo.

It should also speak to the CRO and CEO, not only the analyst building a dashboard. Include template language for the analyst, but frame the article around revenue decisions: where pipeline is stuck, who owns the next task, which seller needs help, and which internal constraint is slowing deals. That makes the post more useful and more likely to convert.

The strongest article should give the reader a simple promise: after reading, they can run a sharper revenue review tomorrow. They know which KPIs to inspect, which questions to ask, and why a sales dashboard should include execution work, not only CRM fields.

Sales performance is not just seller performance. It is company performance expressed through revenue. Commandix makes that visible by connecting pipeline, people, tasks, and constraints in one executive workflow.

Open the sales performance workflow.

Use the demo to move from dashboard revenue signal into the sales unit, people view, deals, and tasks.

Open live demo

Frequently asked questions

What should a sales team performance dashboard include?

It should include open pipeline, weighted value, won revenue, active deals, deal owner, sales tasks, overdue follow-ups, rep performance, and execution risk.

How is Commandix different from a CRM dashboard?

A CRM dashboard reports sales data. Commandix connects sales performance to tasks, owners, departments, goals, and constraints.

Can a sales dashboard help identify low performers?

Yes, but it should compare performance with context: pipeline quality, task load, blockers, deal stage, and internal constraints.

See the operating system behind the article.Open Commandix demo