Performance Dashboard System: Build a View That Changes Decisions

A performance dashboard system should connect outcomes, people, work, capacity, constraints, owners, and next actions instead of merely displaying KPIs.

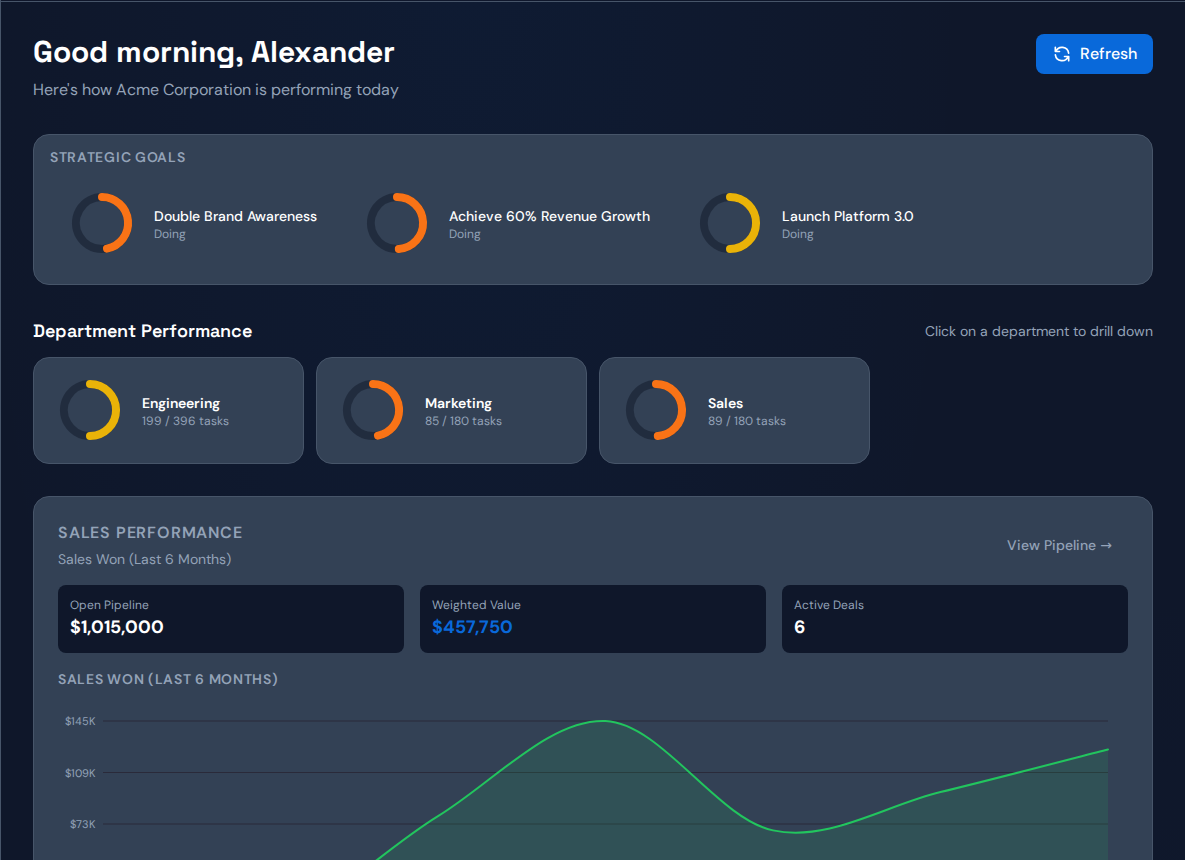
Performance dashboard system command center showing goals, department performance, revenue, and the active constraint in Commandix
Performance dashboard system command centerThe executive layer should reveal the company outcome, operating health, and current constraint without forcing leaders through disconnected reports.
On this page

Key takeaways

  • A performance dashboard system is valuable only when it shortens the path from a weak signal to an accountable decision.
  • The core model should connect outcome, team, work, capacity, constraint, owner, next action, and throughput evidence.
  • Executives need a selective command center with controlled drill-down, not a wall of equally weighted KPIs.

A performance dashboard system should make a company easier to operate. That sounds obvious, yet many dashboards do the opposite. They add charts, filters, scorecards, and alerts until leadership can see almost everything except the decision that matters. The CEO knows a number is weak. The COO knows work is late. The department leader knows the team is busy. Nobody can see the single operating condition that connects those facts.

The problem is not a lack of data. It is a lack of structure. Company outcomes live in strategy documents. Projects live in portfolio tools. Tasks live in boards. revenue lives in the CRM. Team performance lives in spreadsheets or HR systems. A red metric sits above those systems like a warning light with no access to the engine.

A serious performance dashboard solution must connect the warning to the work. It should let leadership start with the company result, inspect the responsible department, reach the project or task evidence, identify the constraint, assign one owner, and verify whether the intervention improved throughput. That is the standard this guide uses.

What a performance dashboard system actually does#

A performance dashboard system combines outcome measurement with execution context. It shows whether goals, revenue, projects, and teams are moving, then preserves the relationships that explain why. A number is not treated as an isolated KPI. It is connected to the owners, work, capacity, dependencies, and constraints that produced it.

That makes the system operational. A business intelligence report may show that delivery slowed. A task system may show overdue work. A workload report may show one overloaded person. The performance dashboard links the three and asks whether the overloaded person is the constraint limiting delivery. If the answer is yes, leadership can protect that capacity instead of demanding more activity from everyone else.

Commandix uses this connected model across goals, departments, projects, tasks, revenue, people, flow analytics, and constraint actions. The dashboard is the top of an execution graph, not a separate presentation layer.

Executive standard

If a dashboard cannot show what to inspect next, it has summarized the problem without helping leadership manage it.

Why KPI dashboards create activity without control#

Most KPI dashboards are assembled by accumulation. Finance adds revenue and margin. Sales adds pipeline and conversion. Operations adds cycle time. Projects add status and completion. HR adds utilization and engagement. Every measure is defensible, but the combined screen has no hierarchy. A leader scans a field of symptoms and chooses attention based on color, politics, or whoever speaks first.

Equal visual weight creates equal management pressure. A low-value overdue task can look as urgent as work blocking a strategic launch. A high utilization score can look positive while queues grow behind a constrained specialist. A strong activity count can hide work that contributes nothing to the goal. The system reports local efficiency while company throughput declines.

The fix is not a more attractive chart. It is a decision architecture. Outcomes belong at the top. Leading execution evidence belongs beneath them. The active constraint deserves a distinct visual priority. Supporting detail should appear only when the leader chooses to inspect it.

Department performance dashboard system comparing team workload, task completion, ownership, and operating results in Commandix, showing Department comparison provides a route.
Department performance dashboard systemDepartment comparison provides a route from company signal to the team context behind it.

The seven layers of a decision-grade dashboard#

A useful performance management system dashboard can be designed as seven connected layers. Each layer answers a different executive question and hands the leader to the next layer when investigation is needed.

LayerExecutive questionEvidence
OutcomeWhat result are we protecting?Goal progress, revenue, delivery result
OrganizationWhere is the signal located?Department, team, role, accountable leader
ExecutionWhat work creates the result?Projects, tasks, deals, milestones
CapacityCan the system absorb the demand?Workload, WIP, queue depth, ownership concentration
ConstraintWhat currently limits throughput?Wait time, blocked value, repeated dependency pressure
ActionWho will change what next?Owner, action type, due date, priority
VerificationDid the system improve?Cycle time, completed work, flow efficiency, throughput trend

Separate outcome, leading, and diagnostic measures#

Outcome measures tell leadership whether the business result arrived. Revenue, strategic goal completion, customer retention, and project delivery belong here. They matter, but they are late. By the time an outcome measure turns red, the operating causes may have been accumulating for weeks.

Leading measures show risk while action is still possible. Aging work, queue depth, overdue deal tasks, blocked milestones, workload concentration, and flow efficiency reveal pressure before the outcome fails. Diagnostic measures explain where to look: person-level assignments, project dependencies, task history, and ownership patterns.

A dashboard should not mix these measures without labels. Leaders must know whether they are seeing a result, an early warning, or evidence used to diagnose the warning. That distinction prevents a diagnostic clue from being treated as a performance verdict.

Outcome

Did the result happen?

Leading signal

Is the result becoming more or less likely?

Diagnostic evidence

What operating condition explains the signal?

Performance dashboard goal view showing strategic outcomes, owners, progress, deadlines, and linked execution in Commandix for performance dashboard system
Goal traceability in a performance dashboardGoals anchor the dashboard to outcomes so activity is judged by whether it moves the result.

Design the executive drill-down path#

A command center earns trust when every summary can be inspected. The path should be short and predictable: Dashboard → Department → Person or project → Task or deal evidence. A leader should not need an analyst to reproduce the number or a manager to prepare a separate slide.

The drill-down also protects teams from shallow conclusions. If one person has the lowest completion signal, the manager can inspect assigned volume, priority, blocked work, due dates, and dependencies. If a sales number is weak, the CRO can inspect pipeline quality, unfinished deal work, owner load, and internal support. Speed and context can exist together.

Commandix is designed around that path. The executive layer remains calm because detail is hidden until needed. Once a signal is selected, the system exposes the work and ownership that make the number defensible.

Make the constraint the visual priority#

Most performance dashboards prioritize the worst percentage. Constraint-based management prioritizes the factor that limits the goal. Those are not always the same. A team can have the lowest local score without limiting company throughput. A high-performing specialist can be the constraint because critical work queues behind that person.

The dashboard should name the candidate constraint and show the evidence: impacted goal, owner, queue depth, waiting time, blocked value, workload, and confidence. It should then support a clear response. Exploit means protecting the constraint from waste. Subordinate means aligning other work around it. Elevate means adding capacity only when the evidence supports investment.

This is the difference between performance reporting and performance management. The first tells leadership where a number is bad. The second identifies where a change can improve the whole system.

Constraint rule

Do not optimize every red metric. Improve the point that limits the outcome, then verify that throughput moved.

Project portfolio performance dashboard showing initiative status, ownership, priority, dates, and delivery pressure in Commandix for performance dashboard system
Project portfolio performance dashboardPortfolio evidence shows which initiatives compete for the same constrained capacity.

Choose a performance dashboard solution by decision quality#

Vendor evaluations often compare chart libraries, integrations, filters, and export formats. Those features matter after the operating model works. Begin with the leadership decision. Ask the product to show a weak company outcome, trace it into the responsible work, distinguish workload from the actual constraint, and record the next action.

Then test whether the platform can preserve role context. CEOs need company-wide exceptions. COOs need flow and capacity. CROs need pipeline connected to execution. PMOs need portfolio dependency pressure. Department leaders need enough task and person evidence to coach without turning the system into surveillance.

Finally, inspect governance. Performance, revenue, strategy, and employee data require tenant isolation, role-based access, secure authentication, auditability, privacy controls, and procurement documentation. A useful dashboard must also be a responsible enterprise system.

Performance dashboard buyer checklist

  • Start from a company outcome rather than a generic metric library.
  • Trace summaries to departments, owners, projects, tasks, and deals.
  • Show workload, waiting, blocked value, and flow in the same context.
  • Identify the active constraint and support an owned next action.
  • Verify improvement with throughput evidence at the next review.
  • Document metric definitions, access control, privacy, and audit behavior.
  • Keep the executive view understandable without custom training.

Implement the system in 30 days#

Week one should define one outcome and one operating flow. Do not import every historical KPI. Name the goal, owner, review cadence, and five to eight measures that can change a decision. Establish exact definitions for active, blocked, completed, at risk, and overdue.

Week two connects the execution graph: department, project, task, person, and revenue objects as needed. Week three runs the first constraint review. Leadership finds where work waits, identifies repeated ownership or dependency pressure, and assigns one action. Week four compares the new flow with the baseline.

Adoption should be measured through meeting quality. Are reviews shorter? Are owners clearer? Is blocked work discovered earlier? Do leaders stop asking for custom reports? A dashboard that receives many visits but changes no decisions has not been implemented successfully.

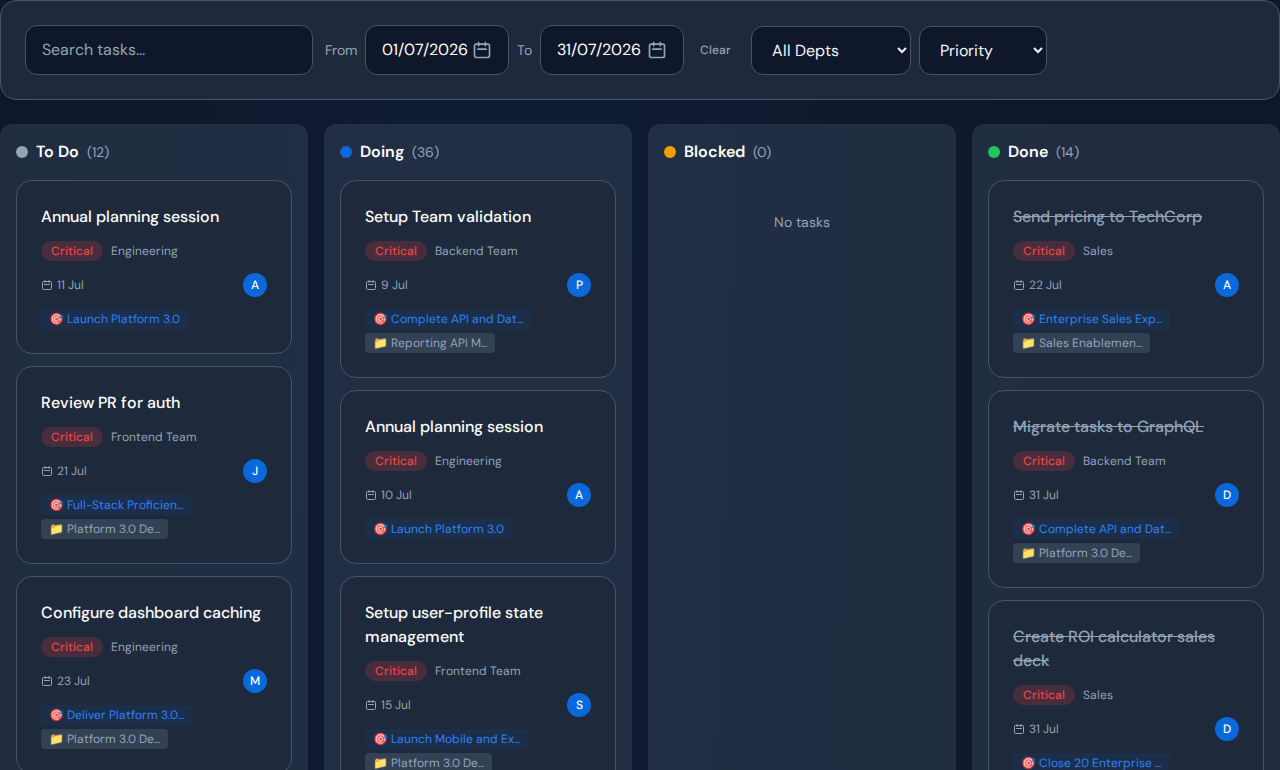
Performance dashboard task evidence showing work status, priority, owner, project, and due date in Commandix for performance dashboard system
Task evidence behind performance metricsA controlled task drill-down makes summary metrics inspectable without turning the executive dashboard into a task board.

Measure return on the dashboard investment#

The return does not come from viewing the dashboard. It comes from earlier intervention and less management friction. Track reporting hours removed, meeting time reduced, age of blocked work, cycle-time change, project delay avoided, revenue work rescued, and throughput after constraint actions.

Also measure decision latency: the time between a performance signal appearing and an accountable action being assigned. That interval is often invisible, yet it explains why companies repeatedly discover known problems too late. A connected system can compress days of report gathering into a few minutes of inspection.

The emotional return is operating confidence. Leaders know where to look. Managers can explain why priorities changed. Teams see the relationship between work and outcomes. The company becomes calmer because it can respond to evidence before urgency takes over.

Build a dashboard that tells leadership what to fix first#

A performance dashboard system should not be judged by how much information it can hold. Judge it by how clearly it identifies the result at risk, the operating evidence behind it, the current constraint, the accountable owner, and the next action.

For a deeper comparison of product categories, read the performance management dashboard solutions buyer guide. To see how the executive layer connects goals, projects, revenue, and flow, use the executive performance management dashboard guide.

Commandix turns that model into a live operating surface. The destination is not a dashboard that leadership admires. It is a company that can see what limits execution and move it before the quarter slips.

Inspect the operating system behind performance.

Open Commandix and move from company outcomes to departments, work, owners, constraints, and measurable next actions.

Open live workspace
Performance dashboard constraint analysis identifying the limiting queue, owner, impact, evidence, and next action in Commandix for performance dashboard system, showing.
Constraint analysis in a performance dashboard systemConstraint analysis converts the dashboard from a reporting surface into a decision about what leadership should fix first.

Frequently asked questions#

What is a performance dashboard system?#

A performance dashboard system connects business outcomes to departments, people, projects, tasks, revenue, capacity, constraints, owners, and next actions so leaders can manage performance rather than only report it.

What should a performance dashboard include?#

It should include a selective outcome layer, leading execution signals, controlled drill-down, workload and flow context, constraint evidence, accountable actions, and throughput verification.

How is a performance dashboard different from business intelligence?#

Business intelligence primarily analyzes and visualizes data. A performance dashboard system should preserve the operating relationships required to choose an owner, move an action, and test whether performance improved.

Who uses a performance dashboard system?#

CEOs, COOs, CROs, PMOs, department leaders, RevOps teams, and operating managers use it to understand outcomes and intervene in the work system behind them.

See it in Commandix

See performance with the operating context intact.

Move from department signal to people, workload, blockers, and responsible work in the live Commandix workspace.
Open live demo
Back to all Commandix articles