Key takeaways
- An executive performance management dashboard should compress company complexity into a clear operating decision, not a wall of KPIs.
- The essential chain is Goal → Project → Task → Owner → Constraint → Next action → Throughput.
- The dashboard earns executive trust when every summary can be traced to real work and every intervention can be tested against flow.
An executive performance management dashboard should make a difficult company easier to operate. It should tell a CEO whether the goal is moving, show a COO where flow is degrading, help a CRO connect pipeline risk to execution, and warn a PMO when several projects depend on the same constrained resource.
Most executive dashboards do something smaller. They arrange lagging indicators into a polished screen. Revenue is beside project status. Headcount is beside utilization. Goals are beside task completion. The information may be accurate, but the relationship between the numbers remains invisible.
That is why executive teams can spend an hour reviewing data and leave without one decisive action. They have seen what happened. They have not identified what limits the result now. A better dashboard closes that distance. It connects strategy to work, work to ownership, ownership to constraints, and constraints to the next action leadership can move.
The job of an executive performance dashboard#
The job is not to display the entire company. The job is to reduce the company's operating complexity without hiding the evidence required for a sound decision. That requires hierarchy.
At the top, executives need outcomes: strategic goals, revenue direction, portfolio health, and critical operating risk. Beneath each outcome, they need the contributing teams, projects, tasks, deals, and owners. Across that execution graph, they need flow evidence that shows where work waits, ages, or becomes blocked. Finally, they need a named constraint and a practical action.
This structure lets leaders scan broadly and inspect narrowly. The CEO can understand the company in seconds, then drill into one department or workflow when a signal deserves attention. The dashboard remains an executive surface because task detail appears on demand, not because detail is removed.
Summaries create speed. Traceability creates trust. An executive dashboard needs both.
Why KPI walls fail leadership teams#
A KPI wall treats every measure as an independent fact. But companies operate as systems. Goal progress depends on projects. Projects depend on tasks and owners. Revenue depends on deal work and internal support. Flow depends on capacity, sequence, and decisions. When those relationships disappear, leaders fill the gaps with assumptions.
KPI walls also create attention inflation. When everything is marked important, nothing is prioritized. Executives bounce between red numbers, each owned by a different department. Every leader explains why their metric is complicated. The meeting becomes a defense of local performance instead of a decision about system throughput.
A third problem is delayed detection. Lagging indicators such as quarterly revenue, project completion, and goal attainment matter, but they reveal failure after the operating causes have accumulated. The dashboard must pair them with leading signals: aging work, queue depth, blocked value, cycle time, workload concentration, overdue next actions, and stalled deal tasks.
The final failure is action ambiguity. A red indicator with no accountable owner and no inspection path creates anxiety, not control. The dashboard should make the route to evidence explicit.
Build the execution chain, not another scorecard#
The most useful architecture for an executive performance management dashboard is a connected execution chain:
Goal → Project → Task → Owner → Constraint → Next action → Throughput.
The goal establishes why the work matters. The project groups the coordinated change required. Tasks make execution concrete. Owners create accountability. Constraint analysis identifies the point that limits progress. The next action turns diagnosis into commitment. Throughput shows whether the intervention worked.
Each link prevents a common management failure. Goals without projects become aspirations. Projects without tasks become status narratives. Tasks without owners become shared intentions. Owners without capacity context become scapegoats. Constraints without actions become interesting analysis. Actions without throughput evidence become executive theater.
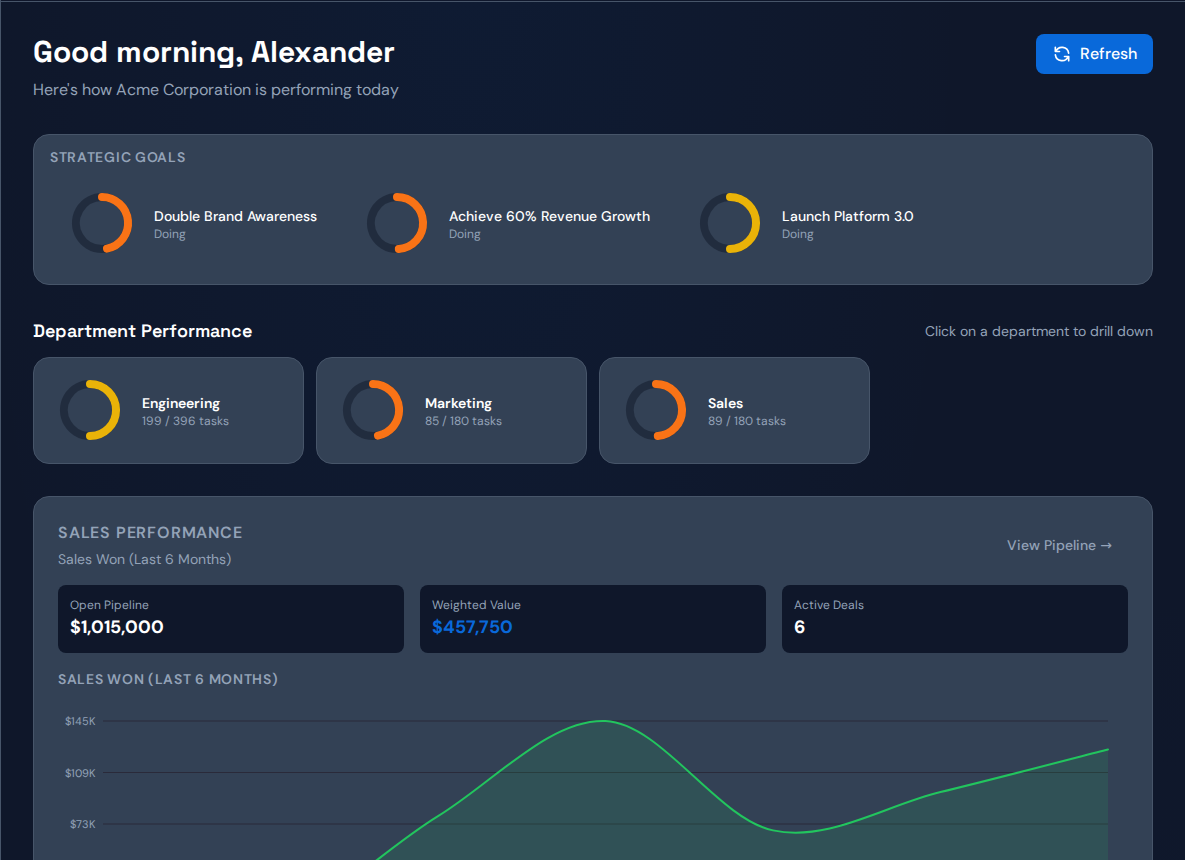
Commandix models this chain so leadership can begin with the outcome and follow the evidence into the operating system. The dashboard is not a separate reporting layer placed over work. It is the entry point to the connected work itself.
Start with strategic goal traceability#
Every executive dashboard should make the company goal visible and specific. It needs an owner, target, timeframe, progress state, and contributing work. A goal called "grow faster" cannot guide execution. A goal tied to defined projects, revenue motions, and measurable completion can.
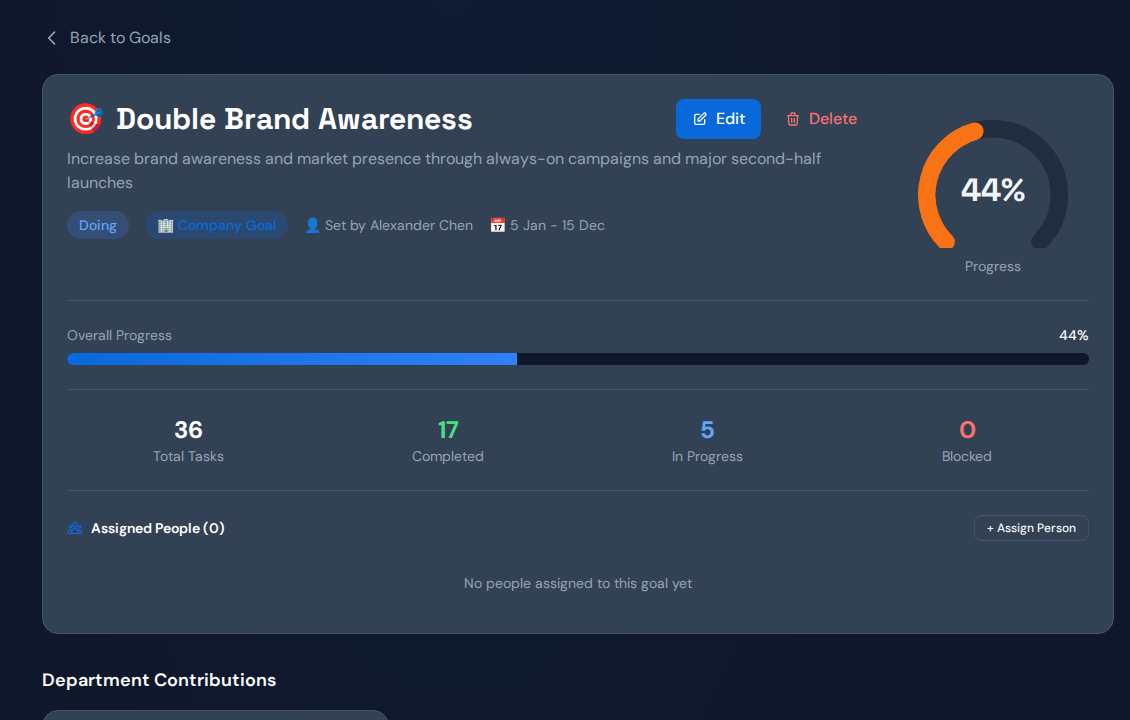
Goal traceability answers whether current work deserves capacity. When a team proposes another initiative, leadership can see which goal it supports and which constrained owner it needs. When a goal slips, the dashboard can expose the projects and tasks behind it rather than requesting another narrative update.
This creates strategic discipline. Teams stop treating every request as equally urgent. Executives can distinguish necessary work from work that is merely visible. The portfolio becomes a set of investments in outcomes rather than a collection of active projects.
Connect the project portfolio to constrained capacity#
Project dashboards usually show status, dates, owners, and completion percentages. Those fields are useful, but they miss the reason portfolios fail: projects share a finite operating system. Several green projects can depend on the same specialist and collectively create a red future.
An executive project view should reveal dependency pressure, aging work, blocked milestones, competing priorities, and repeated owners. It should help a PMO see whether a delivery risk is local to one initiative or systemic across the portfolio.
This is where constraint thinking changes portfolio management. The answer is not always to push every project harder. Leadership may need to stop starting, sequence work, protect one owner, or subordinate lower-value initiatives until constrained capacity clears. The dashboard should make that tradeoff visible before dates slip.
| Portfolio signal | Weak interpretation | Executive interpretation |
|---|---|---|
| Several projects are at 70 percent. | Delivery is mostly on track. | Are they all waiting for the same final capacity? |
| One owner has many assignments. | The owner is highly utilized. | Is the owner limiting completion across the portfolio? |
| New projects start on schedule. | Planning is successful. | Is starting more work increasing queues and cycle time? |
| Milestones are marked yellow. | Managers should provide updates. | Which shared constraint explains the pattern? |
Keep task evidence one controlled drill-down away#
Executives should not manage from a task list, but they must be able to inspect one. Without task evidence, summaries become political. Each department can explain a weak result differently, and leadership has no shared operating record.
A controlled drill-down solves this. From a company signal, the leader opens the relevant department, project, person, or deal, then inspects the tasks behind the result. Status, priority, owner, due date, blocked state, and completion history make the summary testable.
This path should be fast enough to use during the operating meeting. Commandix makes it possible to move from the dashboard to a department and its tasks in two clicks. Leaders can identify the lowest or highest completion signal for the month, then inspect the work rather than stopping at the ranking.
The same design protects executive focus. Detailed work remains below the summary until it is needed. Leadership gets clarity without losing truth.
Put revenue inside the operating system#
Revenue is often treated as a separate world. The CRM shows pipeline, stages, amounts, owners, and close dates. The work required to move those deals lives elsewhere. That separation makes a revenue forecast look more certain than the execution behind it.
An executive performance dashboard should connect pipeline to seller activity, deal tasks, internal dependencies, blocked proposals, implementation capacity, and follow-up aging. This lets the CRO distinguish a demand problem from an execution problem. It lets the CEO see whether revenue risk is caused by market conditions, seller performance, or a company bottleneck.
It also creates a fairer sales performance view. Comparing only booked revenue can hide territory quality, deal allocation, and support constraints. Comparing activity alone rewards motion. Connected evidence shows who drives outcomes, who needs support, which work remains unfinished, and where the company is slowing its own sellers.
Which revenue outcome is at risk?
Which seller work, dependency, or handoff explains it?
Who owns the next action, and when will it move?
Use flow analytics to expose the constraint#
Flow metrics describe how work moves through the system. Cycle time measures how long active work takes. Lead time includes the wait before work begins. Flow efficiency compares active time with total elapsed time. Work in progress shows how much has been started. Queue age and blocked work show where delay is accumulating.
These measures are leading evidence. They can warn leadership before a project date, revenue target, or strategic goal turns red. They also verify whether an intervention worked. If leadership protects a constrained owner but queue age and cycle time do not improve, the diagnosis may be incomplete.
Constraint analysis should combine flow with business context. A busy owner is not automatically the constraint. The constraint is the point limiting throughput relative to the goal. The strongest executive dashboard names that point, shows the impacted outcome and blocked value, identifies an owner, recommends a next action, and tracks the result.
This is what turns analytics into management. The meeting stops asking, "Why is this chart red?" It asks, "What do we change in the system this week?"
Choose KPIs that can change a decision#
The executive layer should stay selective. A measure belongs on the main dashboard only when it helps leadership choose where to inspect, what to change, or whether the change worked.
| Measure family | Examples | Decision supported |
|---|---|---|
| Outcomes | Goal progress, revenue, delivery result | Which result needs leadership attention? |
| Flow | Cycle time, lead time, flow efficiency, completed work | Is the operating system moving faster or slower? |
| Capacity | Workload concentration, active WIP, queue depth | Where is demand exceeding available capacity? |
| Risk | Blocked value, aging work, overdue milestones | Which emerging problem can still be prevented? |
| Revenue execution | Weighted pipeline, stage age, deal-task completion | Which pipeline risk is operational? |
| Constraint action | Owner, next action, due date, throughput change | Did the leadership intervention improve the system? |
Every measure should have a definition, source, owner, review frequency, and expected response. If a metric stays on the dashboard for months without changing a decision, move it to a supporting report.
Run a weekly executive operating cadence#
A dashboard creates value when it changes the meeting. A strong weekly review can follow five steps. First, see the goal and determine whether the expected outcome is moving. Second, identify the current constraint using flow, workload, project, team, and revenue evidence. Third, assign the owner responsible for moving the intervention. Fourth, commit the next action. Fifth, verify throughput at the next review.
The meeting should not become a tour of every department. Start with exceptions and constraints. Let stable areas remain quiet. Spend executive attention where one decision can protect the most value.
Document the action in the same system as the evidence. This prevents the familiar gap between a clear meeting and a forgotten week. At the next review, ask whether the queue shrank, cycle time improved, blocked value moved, project risk changed, or revenue work advanced.
Weekly executive review
- Confirm the company outcome and the period being protected.
- Review changed signals, not every available metric.
- Name the current constraint and the evidence supporting it.
- Choose one action with one accountable owner and due date.
- Protect the constraint from conflicting work where necessary.
- Verify the throughput effect before adding another intervention.
- Record what leadership learned about the operating system.
A 90-day implementation roadmap#
In the first 30 days, establish the executive model. Define the company goals, operating hierarchy, key owners, and five to ten decision-grade measures. Connect one critical workflow end to end. Do not begin with every department.
In days 31 through 60, add the project, task, team, and revenue evidence required for drill-down. Define constraint signals such as queue depth, aging work, blocked value, and repeated dependency pressure. Run the weekly operating cadence and remove measures that create discussion without action.
In days 61 through 90, expand to additional departments and portfolio views. Formalize data access, metric definitions, audit requirements, retention, and privacy documentation. Compare baseline flow with current flow. Ask whether decisions happen faster, blocked work ages less, and executive meetings produce clearer ownership.
The implementation is successful when leaders trust the evidence and the operating rhythm changes. Dashboard logins alone are not adoption. Better decisions, earlier intervention, and measurable throughput improvement are adoption.
Governance, fairness, and executive trust#
Executive performance data includes sensitive information about employees, strategy, revenue, and operating risk. The platform must support tenant-scoped isolation, role-based access, secure authentication, auditability, privacy controls, and clear procurement documentation.
Metric governance is equally important. Publish definitions. Preserve relevant context. Avoid comparing roles with fundamentally different work. Let managers inspect dependencies and capacity before treating an individual signal as a performance conclusion. Make corrections traceable.
Trust also depends on honesty about the system's limits. A dashboard can reveal patterns and prioritize inspection. It cannot understand every human circumstance. Executive judgment remains responsible for interpretation and action.
Executive dashboard selection checklist#
During a product evaluation, ask the vendor to demonstrate your operating questions, not their preferred feature tour. Can the platform begin with a company goal? Can it show the team, project, task, deal, and owner behind a weak signal? Can it distinguish workload from the actual constraint? Can it recommend and track a next action? Can it verify whether throughput improved?
Then test usability. A CEO should understand the main view without training. A COO should reach flow evidence quickly. A CRO should connect pipeline to work. A PMO should identify shared capacity risk. Department leaders should have enough context to coach fairly.
Buyer questions
- Does the dashboard connect outcomes, teams, projects, tasks, and revenue?
- Can every executive signal be traced to responsible work?
- Does the system identify the current constraint rather than list generic alerts?
- Can leaders assign and monitor the next action in the same workflow?
- Do flow metrics verify whether the intervention improved throughput?
- Are roles, data isolation, sessions, audit logs, and privacy controls documented?
- Can the platform support a weekly operating cadence without custom reporting?
Move from KPI review to operating control#
The executive performance management dashboard is not valuable because it makes the company look organized. It is valuable because it helps leadership act before the quarter slips. The dashboard should expose the relationship between the goal, the work, the owner, and the constraint while there is still time to change the result.
That creates a calmer executive rhythm. Leaders spend less time collecting explanations. Teams receive clearer priorities. Managers coach from context. Revenue risk becomes connected to execution. Projects stop competing invisibly for the same capacity. Every review has a chance to improve the system rather than merely describe it.
Commandix is built around that operating model. It gives leadership one command center for goals, teams, projects, tasks, revenue, constraints, owners, next actions, and throughput. The destination is not more data. The destination is a company that knows what to fix first.
Explore a complete Commandix workspace with connected goals, projects, tasks, revenue, flow analytics, constraint evidence, owners, and next actions.
Open live workspaceFrequently asked questions#
What is an executive performance management dashboard?#
An executive performance management dashboard connects strategic outcomes to teams, projects, tasks, revenue, constraints, owners, and next actions so leadership can make and verify operating decisions.
Which KPIs belong on an executive performance dashboard?#
Use a small set of outcome, flow, capacity, risk, revenue, and constraint measures that can change a leadership decision. Avoid filling the dashboard with metrics that have no clear owner or action.
How often should executives review the dashboard?#
Most operating signals should be reviewed weekly, with urgent constraint and revenue risks available continuously. Strategic trends may be reviewed monthly or quarterly, but the next-action loop should remain weekly.
How does an executive dashboard differ from a BI dashboard?#
A BI dashboard primarily visualizes data. An executive performance dashboard should connect the signal to operating context, accountable ownership, the current constraint, a next action, and evidence that the action worked.