Performance Management Dashboard Solutions: The 2026 Buyer's Guide

Compare performance management dashboard solutions that connect company outcomes, team evidence, workload, constraints, owners, and next actions.

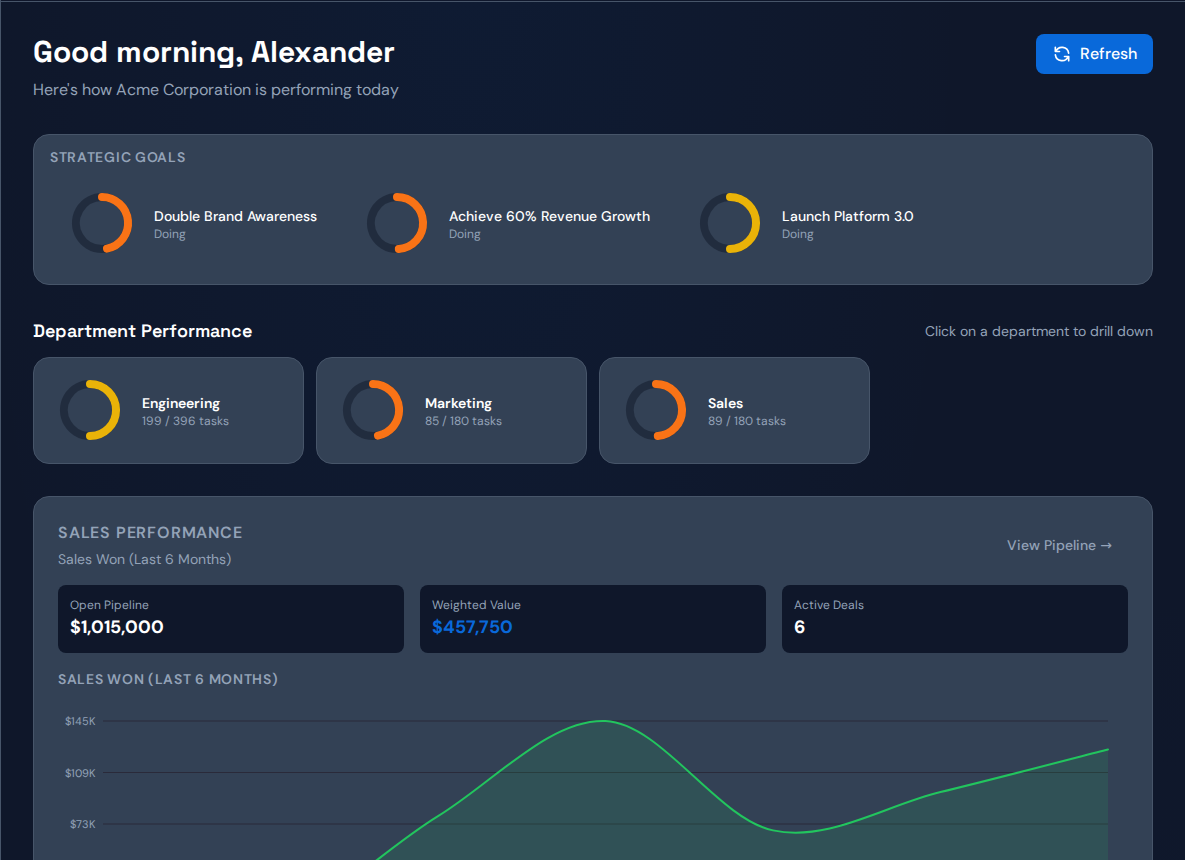
Performance management dashboard solution showing strategic goals, department performance, revenue, and the active company constraint in Commandix for performance management.
Performance management dashboard command centerA useful performance dashboard starts with the company outcome and exposes the operating signals that leadership can act on.
On this page

Key takeaways

  • The best performance management dashboard solutions connect business outcomes to the work, people, capacity, and constraints that create them.
  • A dashboard should help a manager move from a weak signal to responsible work in a few clicks, without turning performance management into surveillance.
  • The buying test is simple: can leadership see what is limiting performance, choose the next action, and verify whether throughput improved?

Performance management dashboard solutions promise clarity. Most deliver a prettier version of confusion. They collect goals, ratings, task counts, utilization, sales numbers, and status colors, then ask a leader to do the hardest part alone: decide what the numbers mean and what should happen next.

That gap is expensive. A CEO sees a department under target but cannot see whether the cause is weak execution, impossible workload, a shared dependency, or the wrong priority. A COO sees late work but cannot tell whether one owner is the constraint or whether the operating process itself is broken. A manager sees a low completion score but cannot tell whether the employee needs coaching or has inherited every blocked task in the team.

A serious performance management dashboard must close that gap. It should connect company outcomes, departments, people, projects, tasks, workload, revenue, constraints, and accountable actions. It should not simply answer, "How are we doing?" It should answer the question an executive is actually paid to resolve: "What should we fix first?"

What is a performance management dashboard solution?#

A performance management dashboard solution is an operating system for understanding and improving performance across a company, team, or individual. It combines outcome metrics with execution evidence so leaders can see not only the result, but also the work system that produced it.

The distinction matters. A business intelligence dashboard can show that sales conversion fell. An employee scorecard can show that one seller completed fewer activities. A task tool can show overdue follow-ups. A performance management dashboard should connect all three. It should reveal whether conversion fell because the seller is underperforming, because qualified opportunities were unevenly distributed, because proposal support became a bottleneck, or because critical follow-up work sat blocked.

That connected view makes performance management useful in the moment. Instead of waiting for a quarterly review, leaders can inspect the signal while there is still time to change the outcome. They can protect a constrained specialist, clarify an owner, remove low-value work, coach a specific behavior, or change the operating sequence.

Executive test

If the dashboard cannot connect a number to an owner, the underlying work, and a practical next action, it is reporting software, not a performance management solution.

Why traditional performance dashboards fail#

Traditional dashboards fail because they reward completeness instead of decision quality. Every department requests its favorite measures. Every stakeholder wants another filter. Soon the dashboard contains dozens of key performance indicators, each competing for attention. The leader receives more visibility and less direction.

The first failure is metric isolation. Goals live in one system, projects in another, tasks in a third, revenue in a CRM, and employee performance in an HR platform. A red metric cannot explain itself across those boundaries. Managers compensate with spreadsheets, screenshots, and meetings.

The second failure is equal weighting. A delayed low-value task appears beside a delayed task blocking a strategic launch. A busy person appears productive even when none of the work advances the company goal. A top-line score hides the one queue limiting throughput. The dashboard displays facts but does not establish priority.

The third failure is lag. Quarterly ratings and monthly summaries explain what already happened. They are useful for records, but weak for execution. Leaders need leading evidence: aging work, blocked value, queue depth, flow efficiency, overloaded owners, stalled deals, and projects competing for the same capacity.

The fourth failure is performance without context. Counting completed tasks can punish the person assigned the hardest work. Comparing sales without territory, deal quality, and support dependencies can reward luck. Measuring utilization can make a constrained team look efficient while its queue grows and the company slows down.

The seven capabilities buyers should demand#

The right solution does not need a thousand features. It needs a small set of connected capabilities that make operating reality legible. The table below separates useful performance management from dashboard decoration.

CapabilityQuestion it answersWhy it matters
Outcome hierarchyWhich company or department goal is affected?Performance stays tied to business value.
Team and person evidenceWho contributes, and what work supports the result?Managers can coach from facts rather than impressions.
Work traceabilityWhich projects and tasks produced the signal?Scores become inspectable and defensible.
Capacity and workloadIs the owner underperforming or overloaded?Leadership avoids blaming people for system design.
Flow analyticsWhere does work wait, age, or become blocked?Leading indicators reveal risk before the result slips.
Constraint analysisWhat currently limits the goal?Attention moves to the highest-leverage intervention.
Action and verificationWho moves what next, and did throughput improve?The dashboard becomes part of the operating cadence.

These capabilities should exist in one navigable model. A leader should be able to start at the company result, open a department, inspect a person or team, and reach the responsible task, project, deal, or constraint without requesting a custom report.

Company performance management dashboard comparing departments, owners, workload, task completion, and operating health in Commandix for performance management dashboard.
Company performance management dashboardCompany and department views create a common performance language without flattening every team into the same metric.

Performance management without surveillance#

Performance data is powerful, which means it can be used badly. A dashboard should sharpen management judgment, not replace it with a leaderboard. The goal is to improve the system and help people succeed, not to create anxiety through constant observation.

Responsible performance management begins with transparent definitions. Team members should know which outcomes matter, how measures are calculated, and what context a manager will consider. The system should distinguish activity from contribution. It should retain enough evidence to explain a score and enough role context to prevent false comparisons.

Access also matters. Executives may need company-wide patterns. Department leaders need their teams. Individual contributors need their own context and the work relevant to them. Tenant-scoped data, role-based access, secure sessions, and audit logs are not procurement decorations. They protect sensitive operating and employee information.

Finally, the dashboard should invite a conversation. A low number is a reason to inspect, not a verdict. A manager should ask whether expectations were clear, whether the person had the required capacity, whether dependencies were available, and whether the assigned work actually contributed to the goal.

Management rule

Use a performance signal to decide where to look. Use evidence and human judgment to decide what it means.

How to identify low and high performers fairly#

Executives want fast answers. They should be able to identify the strongest and weakest performance signals without waiting for a reporting cycle. But speed is only valuable when the drill-down preserves context.

Commandix supports a short inspection path. From the dashboard, a leader can open a department and select its task view to compare who completed the most and least work for the period. In a sales context, the same operating path can reveal who drives the most and least sales. The important part is what happens next: the leader can inspect the work behind the ranking.

For a low performer, examine assignment volume, task difficulty, blocked time, missed due dates, quality, dependencies, and trend. One bad month may indicate a temporary constraint. A repeated pattern across comparable work may indicate a coaching or role-fit issue. Those are different management decisions.

For a high performer, ask a different set of questions. Is the result repeatable? Is this person carrying work that should be systematized? Are they quietly resolving dependencies for everyone else? Could their method be taught? Are they becoming a bottleneck because every difficult decision routes through them?

The last question is frequently missed. A top performer can become the company's most dangerous constraint. Their output looks excellent while queues form behind their expertise. A strong dashboard celebrates the contribution and exposes the operating risk at the same time.

Employee performance dashboard comparing team member contribution and operational results with manager context in Commandix for performance management dashboard solutions,.
Employee performance dashboard comparisonPerson-level comparison is useful only when managers can inspect the work, role, capacity, and dependencies behind the number.

Connect individual performance to team and company outcomes#

An employee performance dashboard becomes useful when it answers three levels of the same question. At the company level: are the strategic and financial outcomes moving? At the team level: which department or flow is helping or limiting that movement? At the individual level: what work and behavior explain the team signal?

This prevents local optimization. A team can complete every assigned task and still fail to advance the goal because the tasks were poorly selected. A salesperson can log high activity without moving qualified pipeline. A project manager can keep every project active while shared capacity becomes overloaded and completion slows.

Connected goals provide the anchor. Projects and tasks show the execution path. Owners establish accountability. Flow evidence shows how work moves. Constraints establish priority. Together, they let leadership evaluate whether effort is turning into throughput.

Company view

Which outcome is at risk, and where should leadership inspect?

Team view

Which department, queue, or workflow explains the signal?

Person view

Which assignments, results, and dependencies support a fair decision?

Why constraint analysis belongs in performance management#

Performance management usually asks who is ahead and who is behind. Constraint management asks a more valuable question: what limits the system from achieving its goal? The answer may be a person, but it may also be a process, policy, dependency, queue, project conflict, or decision delay.

This changes the leadership response. If one engineer has too much critical review work, telling everyone else to code faster adds inventory to the queue. If proposal support limits sales throughput, demanding more prospecting may create more opportunities that cannot progress. If an executive approval blocks several projects, coaching individual project managers will not solve the delay.

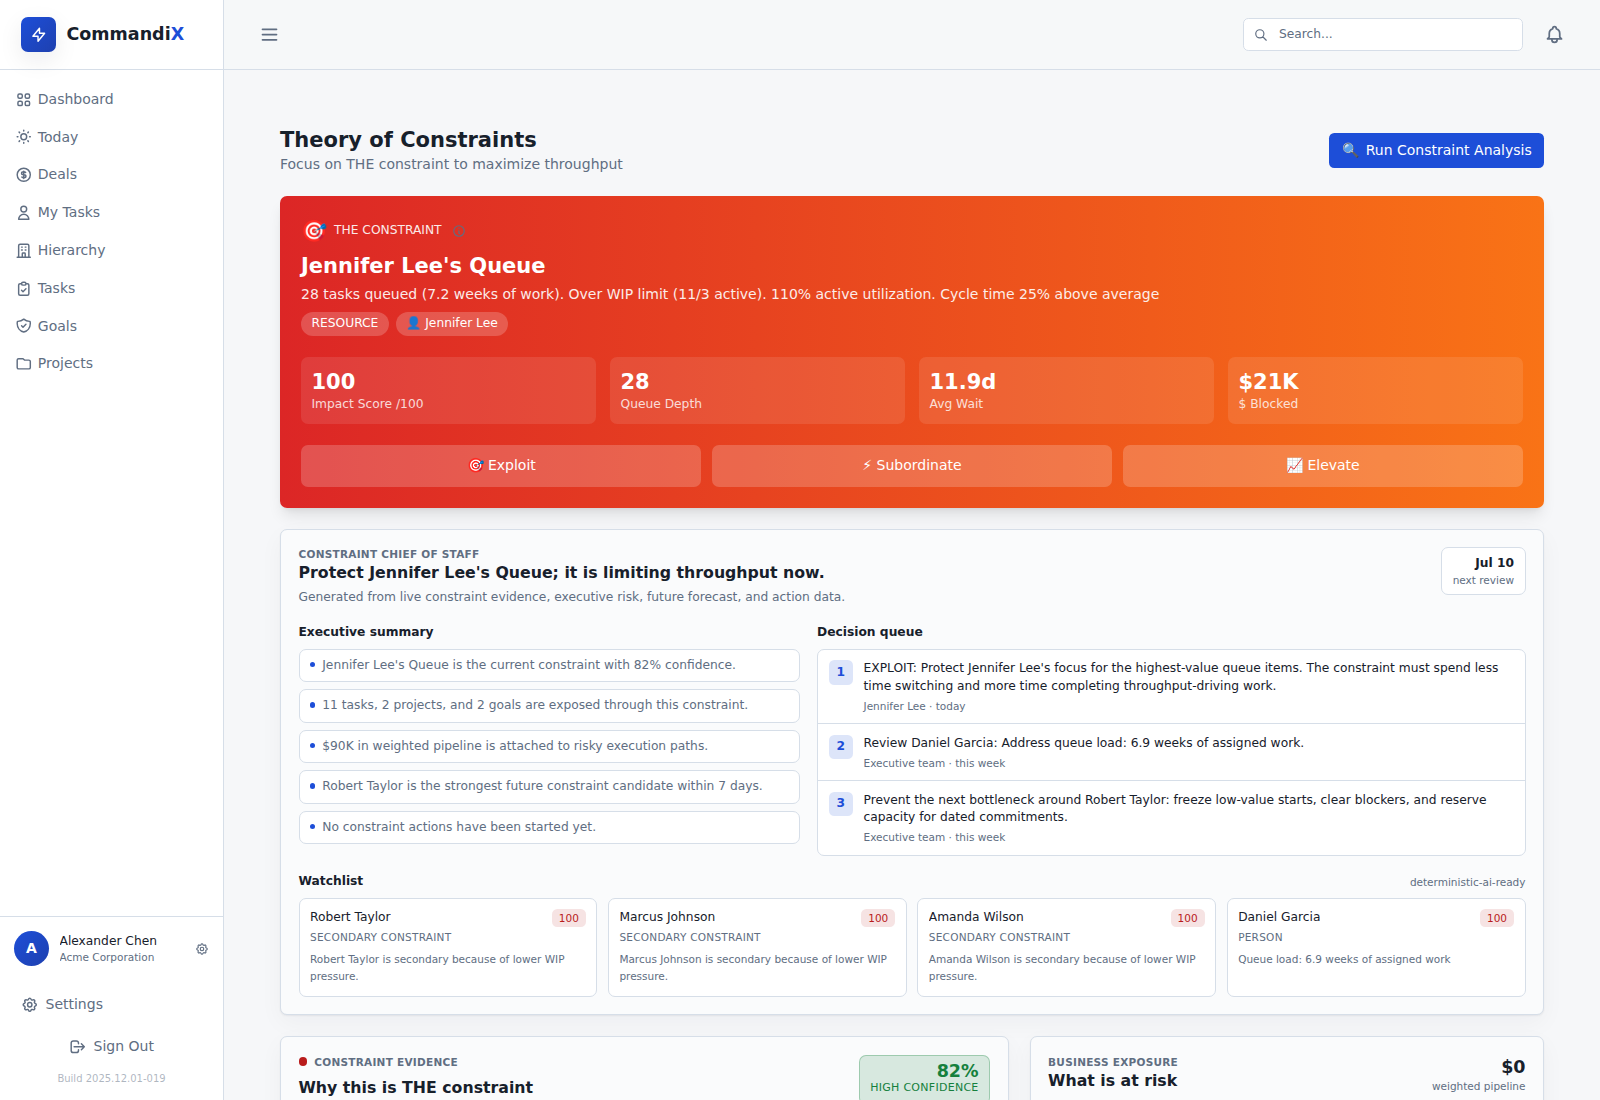
Constraint analysis should show the named constraint, affected goal, impact, owner, queue depth, blocked value, and next action. It should support the Theory of Constraints sequence: exploit the constraint by protecting its productive time, subordinate other work around it, elevate capacity only when evidence justifies investment, and verify whether throughput improved.

That turns the dashboard from a scorekeeper into a management instrument. It tells leaders where one decision can create more value than dozens of disconnected interventions.

Performance management dashboard task evidence showing owners, status, priority, due dates, and completed work in Commandix for performance management dashboard solutions
Task evidence in a performance management dashboardA score becomes trustworthy when a leader can drill into the tasks and operating evidence that produced it.

Performance management dashboard solutions compared#

Buyers commonly compare four categories. Each has value, but only one category is designed to connect performance signals to operating action across the business.

Solution typeStrongest useTypical limitation
Business intelligence dashboardFlexible reporting across large datasetsRequires leaders to interpret and coordinate the action elsewhere.
HR performance platformReviews, competencies, feedback, and employee recordsOften disconnected from daily work, revenue, and constraints.
Project or task dashboardTracking assignments, dates, and delivery statusShows activity without establishing the company-level priority.
Constraint-based execution platformConnecting goals, teams, work, flow, revenue, and bottlenecksRequires a clear operating cadence and disciplined outcome definitions.

Commandix belongs in the fourth category. It is designed for CEOs, COOs, CROs, PMOs, operations leaders, and department managers who need an execution command center rather than another isolated scorecard.

A practical 30-day implementation plan#

Do not begin by importing every historical metric. Start with one operating decision that leadership needs to improve. Choose a company goal, one department or flow connected to it, and the work that should move the result.

During the first week, define the outcome, owner, review period, and source evidence. Agree on what completed, blocked, aging, and at risk mean. During the second week, connect projects, tasks, people, and revenue data where relevant. Keep the initial scorecard small enough for leaders to understand without a legend.

During the third week, run the first constraint review. Find where work waits, which owner or dependency appears repeatedly, and what business value is blocked. Assign one next action. During the fourth week, verify whether cycle time, queue age, completed work, revenue movement, or goal progress improved.

30-day launch checklist

  • Name one company outcome the dashboard must protect.
  • Define five to eight decision-grade measures, not fifty reporting metrics.
  • Connect team, person, project, task, and revenue evidence as needed.
  • Document calculation rules and role-based access.
  • Run a weekly constraint review with one owner and one next action.
  • Measure adoption by decision quality, not dashboard views.
  • Remove any metric that never changes a management decision.
Team workload performance dashboard showing cycle time, flow efficiency, queue load, work in progress, and blocked work in Commandix for performance management dashboard solutions
Team workload and flow performance dashboardFlow and workload evidence separates a coaching issue from a system that has overloaded the person it depends on.

How to calculate the business value#

The value of a performance management dashboard does not come from time spent looking at it. It comes from decisions made earlier and with better evidence. Measure the reduction in manual reporting time, the age of blocked work, project delay avoided, sales follow-up completed, management meeting time, and throughput improvement after constraint actions.

Consider the cost of a missed signal. One shared owner delays three strategic projects. One proposal queue slows several valuable deals. One low-performing workflow remains hidden until quarter end. One top performer burns out because leadership mistakes overload for excellence. Preventing even one of those outcomes can outweigh months of software cost.

The emotional value matters too. Leaders gain control without asking for another spreadsheet. Managers enter coaching conversations with context. Teams understand why priorities changed. The company spends less energy debating whose status report is correct and more energy moving the work that matters.

Common buying mistakes#

The first mistake is buying for the demo rather than the operating meeting. Attractive charts are easy to admire. Ask the vendor to show the complete path from a weak company metric to the responsible team, person, task, constraint, and next action.

The second mistake is measuring everything. More metrics create more ways to rationalize inaction. The best dashboard is selective. It shows enough evidence to support the decision and hides what does not matter now.

The third mistake is treating task volume as performance. Completion counts need context: priority, difficulty, quality, blocked time, and contribution to the goal. The fourth is ignoring data governance. Performance and revenue data require clear access, retention, privacy, and audit controls.

The final mistake is failing to establish a management rhythm. Software cannot improve performance if nobody names the constraint, assigns the action, and checks the result. The dashboard must live inside the weekly operating cadence.

Constraint analysis dashboard identifying the current execution bottleneck, owner, queue depth, impact, and recommended action in Commandix for performance management dashboard.
Constraint analysis performance management dashboardConstraint analysis turns performance reporting into a decision: what limits the goal, who owns it, and what should move next.

The verdict: buy decisions, not dashboards#

The strongest performance management dashboard solutions create a shorter distance between signal and action. They let executives see which outcome is at risk, understand the people and work behind it, identify the current constraint, assign one owner, and verify improvement.

That is a higher standard than colorful charts or quarterly ratings. It is also the standard that creates business value. When performance management is connected to execution, leaders stop discovering problems after the result has already slipped. They can intervene while there is still time, with evidence strong enough to act and context strong enough to act fairly.

Commandix is built for that operating moment. It connects the goal, team, work, revenue, constraint, owner, next action, and throughput in one leadership command center. The company does not need another place to watch activity. It needs to know what to fix first.

See performance in its operating context.

Open a complete Commandix workspace and move from company outcomes to departments, people, tasks, workload, constraints, and next actions.

Open live workspace

Frequently asked questions#

What is a performance management dashboard solution?#

A performance management dashboard solution connects company outcomes, team and individual evidence, workload, work flow, ownership, and next actions so leaders can improve performance rather than merely report it.

What should a performance management dashboard include?#

It should include goals, team and individual contribution, task and project evidence, workload, flow metrics, revenue context where relevant, constraints, accountable owners, and a clear drill-down path.

How is a performance dashboard different from an HR scorecard?#

An HR scorecard usually summarizes people metrics. A performance dashboard connects those people signals to actual work, business outcomes, constraints, and operating decisions.

Can a performance dashboard identify low and high performers fairly?#

It can support fairer decisions when it combines results with role expectations, assigned work, capacity, blockers, dependencies, quality, and trend data. A single leaderboard should never be treated as a complete performance judgment.

See it in Commandix

See performance with the operating context intact.

Move from department signal to people, workload, blockers, and responsible work in the live Commandix workspace.
Open live demo
Back to all Commandix articles