CommandiX Open demo

Flow analytics

Cumulative Flow Diagram for Executives: Spot Delivery Risk Before It Hits the Quarter

A cumulative flow diagram helps leaders see where work is accumulating, where flow is slowing, and where execution risk is building before goals slip.

Flow analytics
Flow analyticsCycle time, lead time, flow efficiency, CFD, workload, and aging WIP for execution diagnosis.

A cumulative flow diagram can look like an operations chart, but for an executive it is really a warning system. It shows whether work is moving, waiting, or swelling inside the system. If the bands are stable, the system may be healthy. If one band widens while completion stays flat, something is piling up. That pileup is not just a chart pattern. It is tomorrow's missed date, next month's frustrated customer, or next quarter's goal review turning awkward.

The reason executives should care is simple: flow problems appear before business problems. A project does not miss the quarter on the last day. It misses the quarter week by week as work waits too long, dependencies age, reviews slow down, and blocked tasks accumulate. A CFD helps leaders see the shape of that delay.

What the chart is actually saying

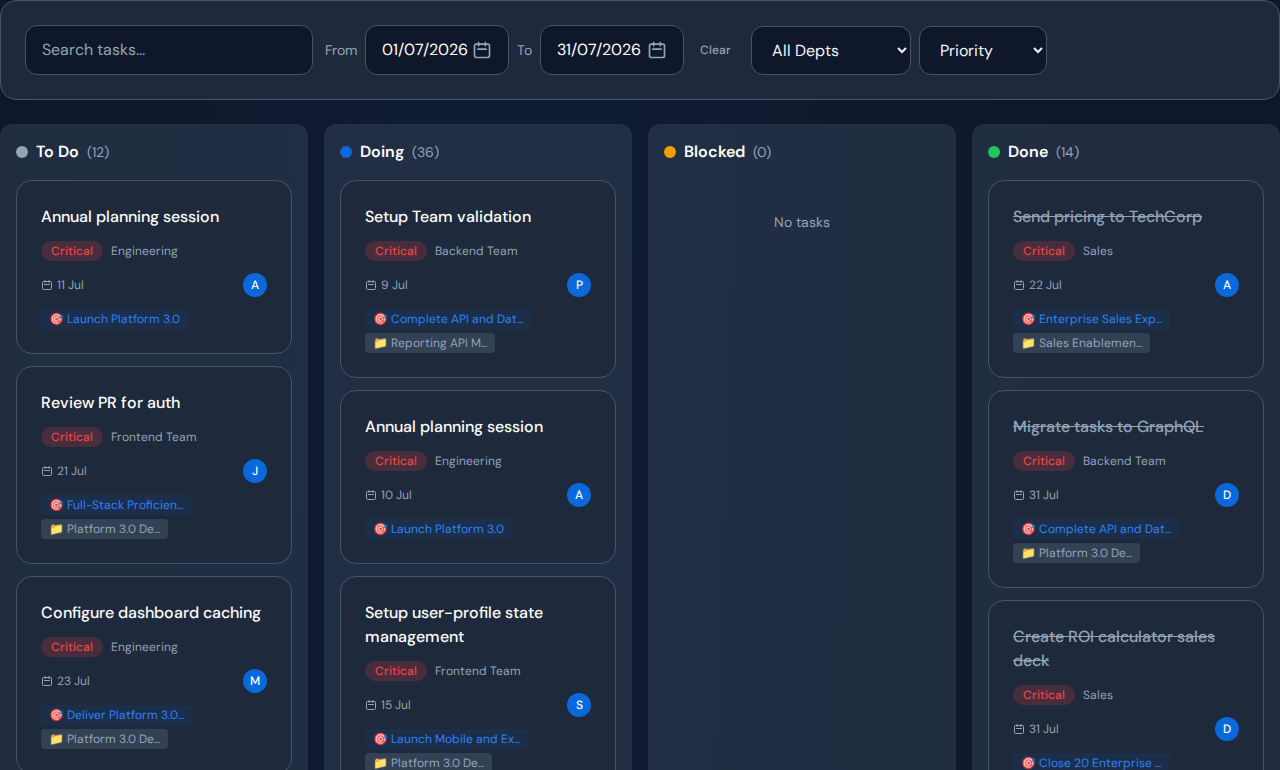
A cumulative flow diagram shows work items across stages over time. In a simple system those stages might be To Do, Doing, Blocked, and Done. The size of each band shows how much work is in that state. When a band grows wider, work is accumulating there. When Done grows steadily, throughput is healthy. When Doing or Blocked grows faster than Done, the system is building inventory.

For executives, the exact chart mechanics matter less than the question it raises: where is work entering faster than it exits? That is where delays are born. That is where leadership attention belongs.

Why CFDs beat status updates

Status updates are often optimistic. People want to be helpful. They summarize. They soften. They say "on track" until suddenly the deadline is not. Flow data is less charming and more useful. It shows whether the system is absorbing work or choking on it.

A CFD also reduces the drama around blame. If blocked work is rising everywhere, the issue is probably not one lazy person. It may be WIP, policy, unclear priorities, or overloaded shared capacity. That is a better conversation. Leaders can ask how to change the system instead of hunting for a villain.

Executive CFD reading guide
Executive CFD reading guideA generated guide that shows the flow signals executives should watch before delivery risk becomes visible.

Cycle time, lead time, and flow efficiency

Cycle time tells you how long work takes once it is actively in progress. Lead time tells you how long the customer or business waits from request to completion. Flow efficiency compares active work time to total waiting time. Together, these metrics expose a painful truth: many teams do not spend most of their time doing the work. They spend it waiting for the work to be allowed to move.

That is where the executive opportunity lives. If a task takes twenty days but only three days of active work, the company does not need a motivational speech. It needs to attack waiting time. It needs to find queues, dependencies, approval delays, and blocked states. It needs to reduce the friction that makes valuable work sit idle.

How Commandix uses flow analytics

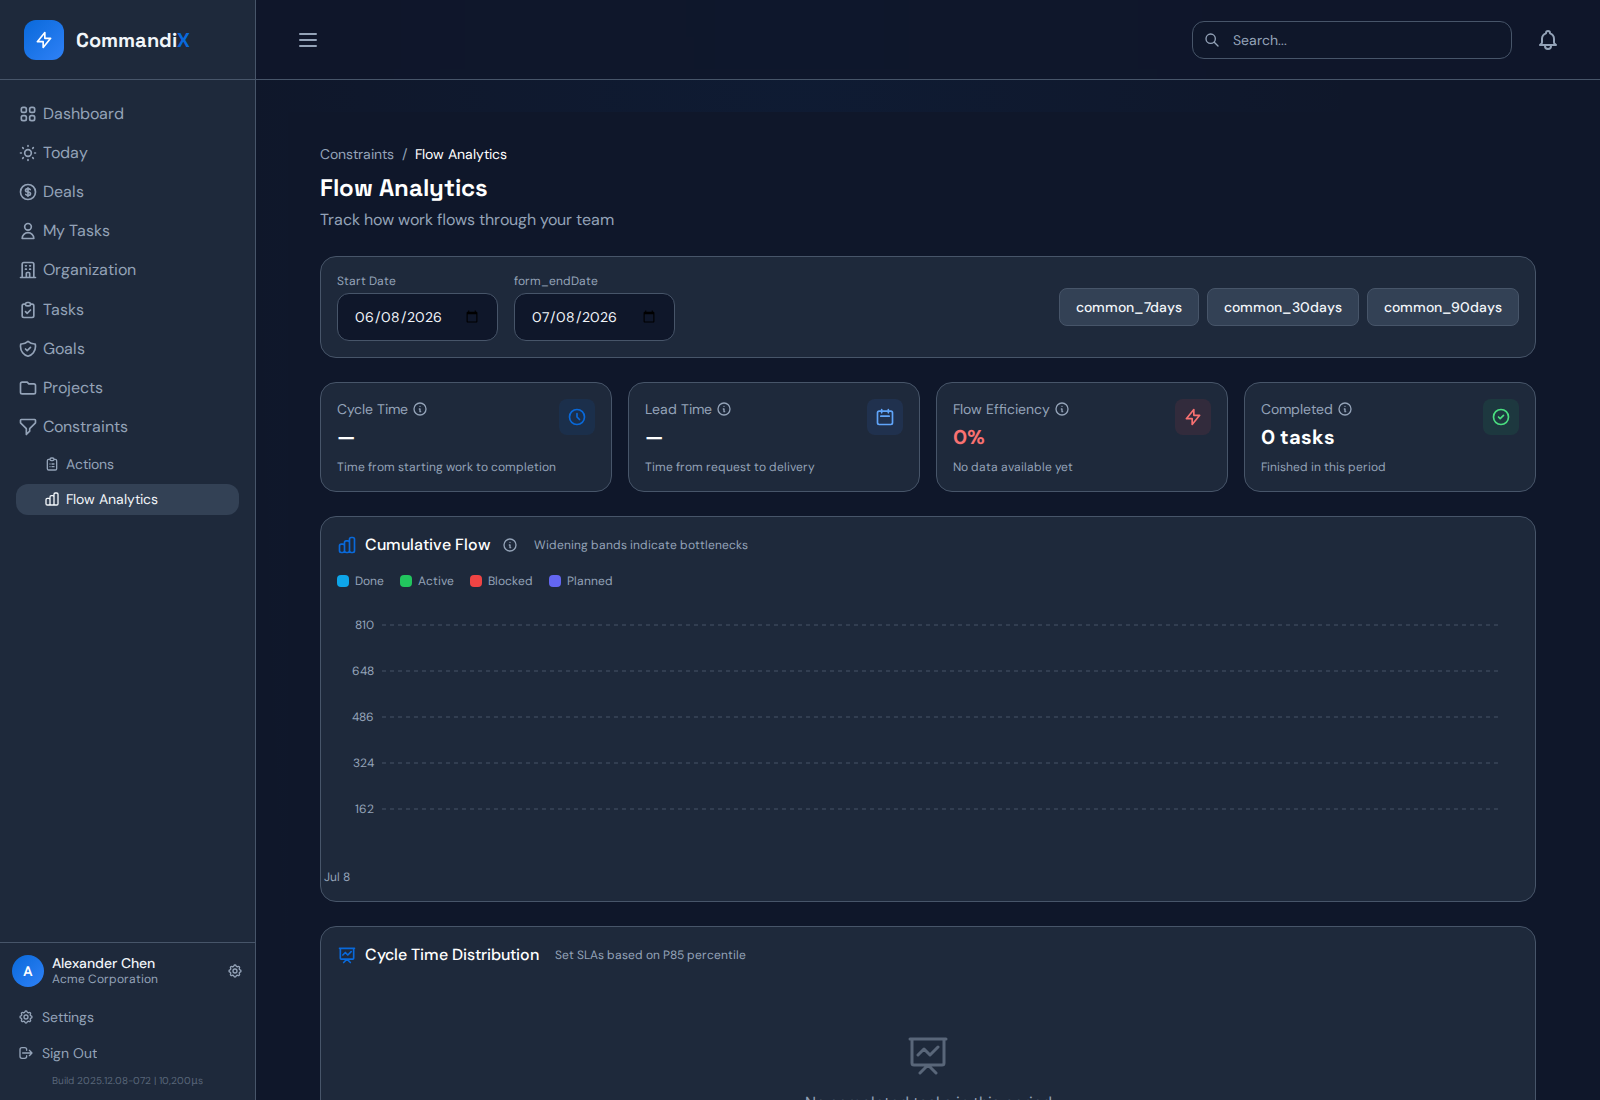
Commandix includes flow analytics because the executive command center must connect status to motion. The flow analytics view gives leaders cycle time, lead time, flow efficiency, completed work, cumulative flow, scatter plots, work type distribution, workload heatmaps, aging WIP, and forecasts. The goal is not to overwhelm the CEO with charts. The goal is to give operating leaders a factual path from "something feels slow" to "this is where the system is slowing."

Flow analytics becomes especially powerful when compared with constraint analysis. A current workload bottleneck may point to an overloaded person. Historical flow may show where work has actually waited. Sometimes those agree. Sometimes they do not. If they disagree, the system should explain why: different date ranges, sparse completed work, current WIP versus historical throughput, or missing transition data.

Constraint identified
Constraint identifiedImpact score, queue depth, wait time, blocked value, and exploit/subordinate/elevate actions.

What if the CFD is empty?

An empty chart should never make leadership shrug. It should teach. A CFD needs enough historical status data in the selected range. If the team has not moved tasks through statuses, or if the date range is too narrow, the chart may be empty. That does not mean there is no bottleneck. It means the chart lacks the data to tell the story.

In that case, leaders can still use workload, blocked tasks, overdue work, queue depth, and person/team performance. They should also improve data discipline going forward. Flow analytics is a feedback loop: better work movement data creates better diagnosis, which creates better action.

Executive reading guide

First, look for expanding bands. They mean inventory is accumulating. Second, compare started work to completed work. If starts rise and completion stays flat, the system is accepting more than it can finish. Third, look for blocked or waiting states. Long waits are usually more important than loud activity. Fourth, connect the pattern to business impact. Which goal, project, customer, or revenue line is affected?

Then act. Do not let the chart become a museum piece. If work is stuck in review, protect review capacity or change the review policy. If too much work is active, reduce WIP. If blocked work is aging, assign executive intervention. If one team is the recurring queue, subordinate other teams to its capacity until flow stabilizes.

Task flow
Task flowPlanned, active, blocked, and done work with owner, goal, project, and priority context.

The value for the business

The business value is early warning. A CFD gives leaders time. Time to adjust scope, change priorities, protect capacity, escalate decisions, and avoid pretending everything is fine until the deadline is already lost. It turns delivery risk from a surprise into a visible shape.

That visibility is energizing because it creates agency. Teams stop saying "we are behind" and start saying "this is where flow is breaking." Leaders stop asking for reassurance and start removing the thing causing the queue. The chart is not the hero. The action is the hero. The chart simply points the way.

The executive superpower is seeing risk while there is still time

A CFD gives leaders a time advantage. When work starts accumulating in a stage, the system is whispering before the business screams. That whisper is valuable. It gives the COO time to reduce WIP, the CEO time to reset priorities, the PMO time to sequence projects, and department leaders time to remove blockers before customers or revenue feel the damage.

This is why flow analytics should not be buried in an agile team report. It belongs in the operating system. Flow is how strategy travels through the company. If flow slows, strategy slows. If waiting grows, business value waits with it.

Organization drill-down
Organization drill-downMove from company signal into departments, teams, and people without waiting for a report.

How Commandix turns flow into leadership action

Commandix puts flow analytics next to constraints, workload, goals, and tasks so leaders can interpret patterns in context. A widening blocked band can be compared with person-level load. Sparse CFD history can be explained by missing status movement while current workload still reveals pressure. A project delay can be tied back to a goal and owner.

The result is more useful than a chart in isolation. Leaders get a complete operating question: where is flow breaking, what business outcome is affected, who owns the next action, and what will we change this week? That question can save a quarter.

The CFD conversation leaders should have

When a cumulative flow diagram shows widening work in progress, do not ask the team to "go faster" as the first move. Ask where the work is waiting. Ask what entered the system without a clear path to completion. Ask whether started work is outpacing finished work. Ask which goal, customer, project, or revenue line is exposed if that band keeps widening for another two weeks.

That conversation turns a technical chart into executive leverage. The diagram becomes a shared picture of risk. A COO can use it to reduce WIP. A VP Engineering can use it to protect review capacity. A CRO can use it to expose internal delays on proposal work. A CEO can use it to explain why starting another project right now would be irresponsible.

Commandix strengthens the conversation by surrounding the CFD with context. The chart is not floating alone. It lives next to aging WIP, workload, constraints, tasks, and goals. Leaders can move from pattern to evidence to action quickly. That speed matters because flow risk is only useful when the business still has time to change the outcome.

Constraint actions
Constraint actionsTurn diagnosis into focused action ownership and follow-through.

The leadership habit that makes CFDs powerful

A CFD becomes powerful when leaders review it before they feel pain. If the chart only appears after a project is late, the company is using it as a post-mortem. The better habit is to scan flow every week, compare it with active constraints, and intervene when work starts aging or swelling in the wrong state.

This is especially valuable for enterprise teams because delay compounds quietly. A review queue grows by five items, then ten, then twenty. A small band becomes a business problem. Commandix helps leaders catch the pattern while it is still manageable and connect it to owners, goals, and action.

Frequently asked questions

What does a cumulative flow diagram show?

It shows how work accumulates across workflow stages over time, helping teams see WIP, queues, bottlenecks, and flow stability.

Why should executives care about CFDs?

Because widening queues and unstable flow often show delivery risk before the quarter is visibly missed.

Can a CFD be empty?

Yes. If the system lacks enough historical status transition data for the selected date range, the chart may be empty and should explain what data is missing.

See the operating system behind the article.Open Commandix demo